• Blog
  • Info Support
  • Career
  • Training
  • International Group
  • Info Support
  • Blog
  • Career
  • Training
  • International Group
  • Search
logo InfoSupport
  • Latest blogs
  • Popular blogs
  • Experts
      • All
      • Bloggers
      • Speakers
  • Meet us
  • About us
    • nl
    • en
    • .NET
    • 3D printing
    • Advanced Analytics
    • Agile
    • Akka
    • Alexa
    • Algorithms
    • Api's
    • Architectuur
    • Artificial Intelligence
    • ATDD
    • Augmented Reality
    • AWS
    • Azure
    • Big Data
    • Blockchain
    • Business Intelligence
    • Chatbots
    • Cloud
    • Code Combat
    • Cognitive Services
    • Communicatie
    • Containers
    • Continuous Delivery
    • CQRS
    • Cyber Security
    • Dapr
    • Data
    • Data & Analystics
    • Data Science
    • Data Warehousing
    • Databricks
    • DataOps
    • Developers life
    • DevOps
    • Digital Days
    • Digital Twin
    • Docker
    • eHealth
    • Enterprise Architecture
    • Event Sourcing
    • Hacking
    • Infrastructure & Hosting
    • Innovatie
    • Integration
    • Internet of Things
    • Java
    • Machine Learning
    • Microservices
    • Microsoft
    • Microsoft Bot Framework
    • Microsoft Data Platform
    • Mobile Development
    • Mutation Testing
    • Open source
    • Pepper
    • Power BI
    • Privacy & Ethiek
    • Python
    • Quality Assistance & Test
    • Quality Assurance & Test
    • Requirements Management
    • Scala
    • Scratch
    • Security
    • SharePoint
    • Software Architecture
    • Software development
    • Software Factory
    • SQL Server
    • SSL
    • Start-up
    • Startup thinking
    • Stryker
    • Test Quality
    • Testing
    • TLS
    • TypeScript
    • Various
    • Web Development
    • Web-scale IT
    • Xamarin
    • All
    • Bloggers
    • Speakers
Home » Scraping and visualizing the weather forecast with Power BI
  • Scraping and visualizing the weather forecast with Power BI

    • By Orhan Uyan
    • Business Intelligence 8 years ago
    • Business Intelligence 0 comments
    • Business Intelligence Business Intelligence
    Scraping and visualizing the weather forecast with Power BI

    Scraping (tabular data) from the internet has become fun with Power Query. The new add-in of Microsoft Excel facilitates data extraction from multiple, various data sources and enables data transformation of the extracted data. The transformed data can be loaded into an Excel data model (Power Pivot) and can be presented by Power View or Power Map in Microsoft Excel.

    In my quest of scraping the internet with Power Query I decided to extract the biggest municipalities from the Statline website (Statistics Netherlands) and to extract the weather forecast from the Buienradar website for each extracted municipality. The gathered data is cleansed, transformed and presented through Power View reports.

    Before informing you about the Power Query ETL process you find the end results below.

    Power View report Temperatuur, kans op Zon en Buien per GemeentePQ - Weather Forecast Municipalities

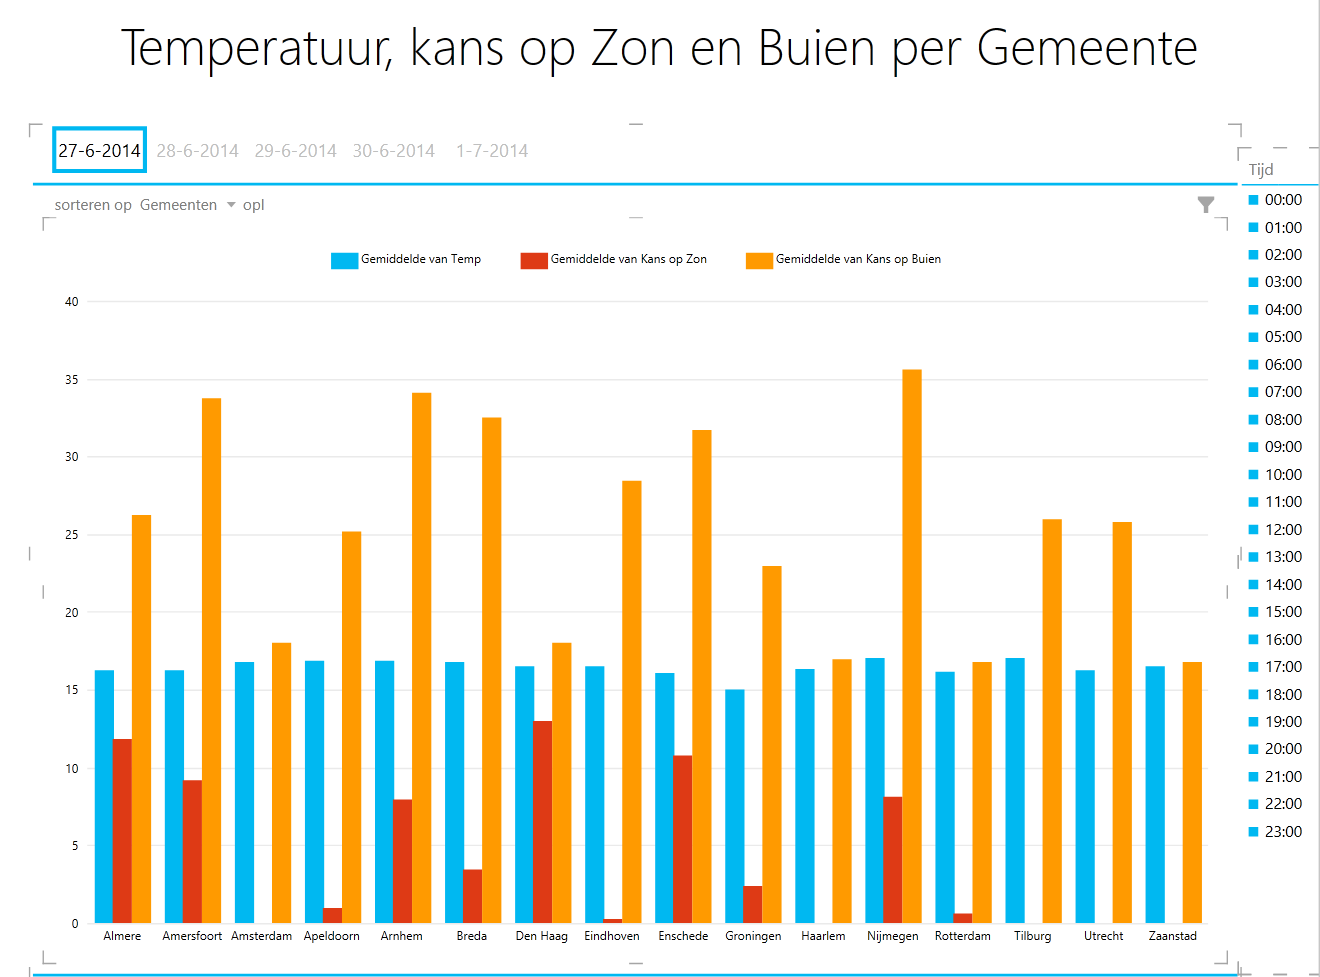
    Translations to English: temperatuur = temperature, kans op = chance of, zon = sunshine, en = and, buien = rainfall, per = per, gemeente = municipality and tijd = time.

    This report shows the average temperature, average chance of sunshine and rainfall for the biggest municipalities (population >= 150.000, date 31-12-2013)  in the coming five days.

    Power View report Neerslag per Gemeente in mPQ - Rainfall Municipalities

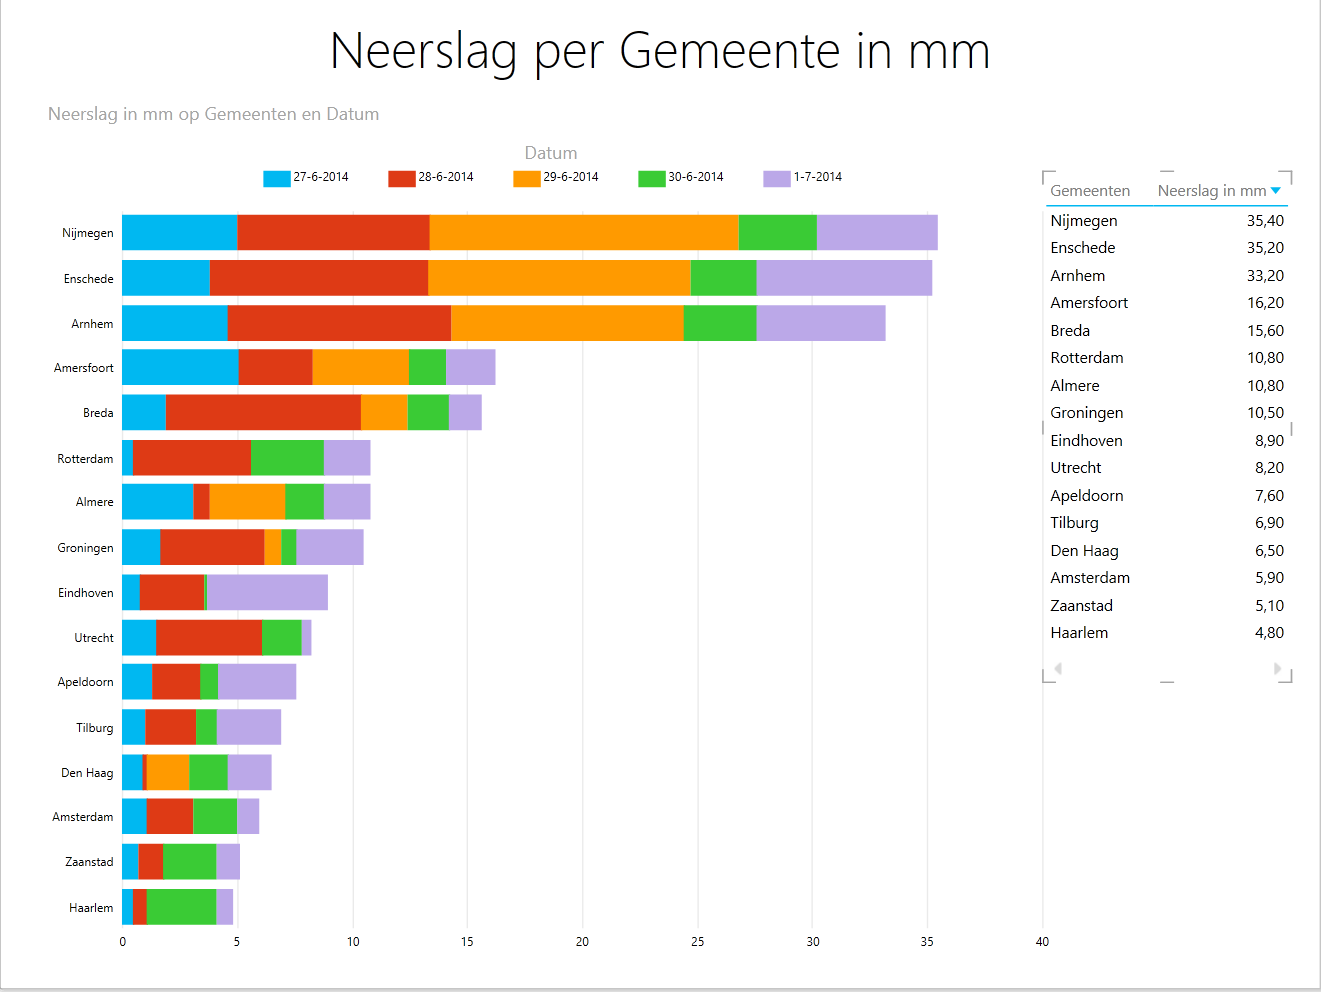
    Translations to English: neerslag = rainfall, per = per, gemeente = municipality, mm = millimeters, in = a and datum = date.

    This report shows the expected rainfall in millimeters for the biggest municipalities (population >= 150.000, date 31-12-2013) in the coming five days.

    The Power View reports are refreshed by the underlying Power Query ETL process. This process consists of the steps shown below.

    Power Query ETL processPQ - ETL Process

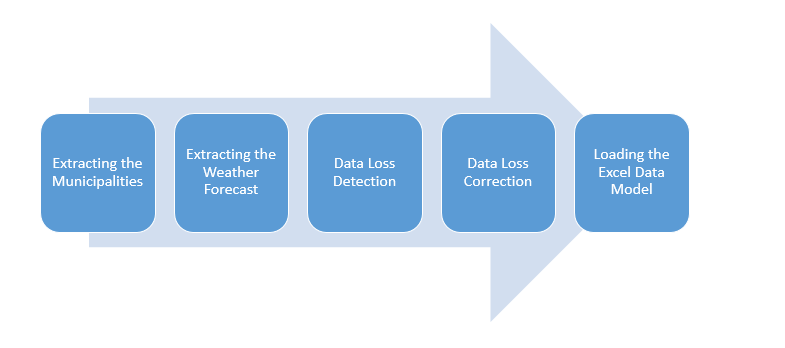
    Each step has his own Power Query ETL script. I will explain the Power Query script, shown below, of the step ‘Extracting the Weather Forecast’.

    Power Query Script ‘Extracting the Weather Forecast’PQ - Extracting Weather Forecast

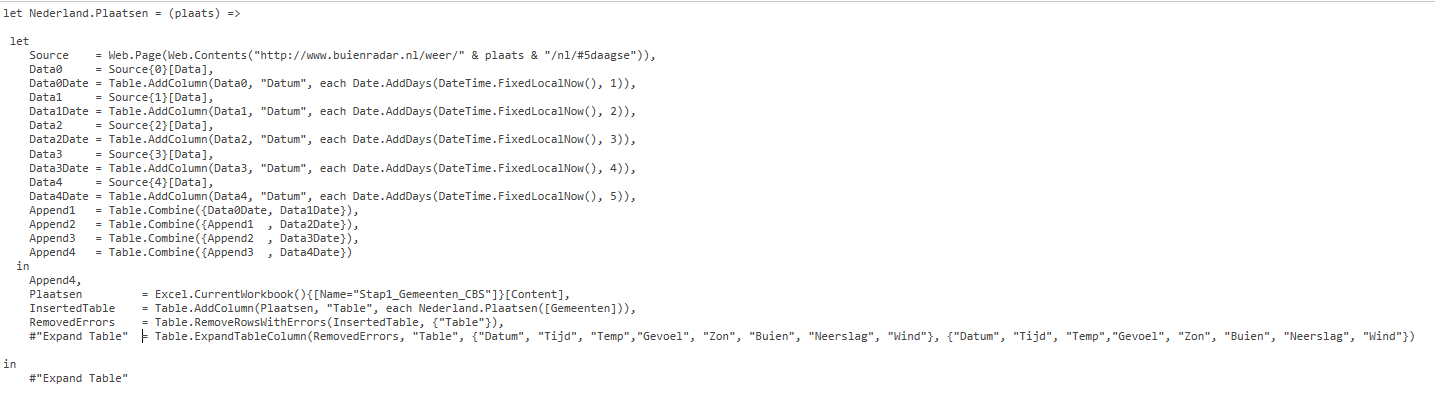
    In the Power Query script the function Nederland.Plaatsen is executed for each extracted municipality. The function generates a different url for each municipality and extracts the weather forecast in tabular form from the Buienradar website. The tables with the forecast information are combined into one data set. The final data set produced at the end of the last step is shown below.

    Final DatasetPQ - Weather Forecast Information

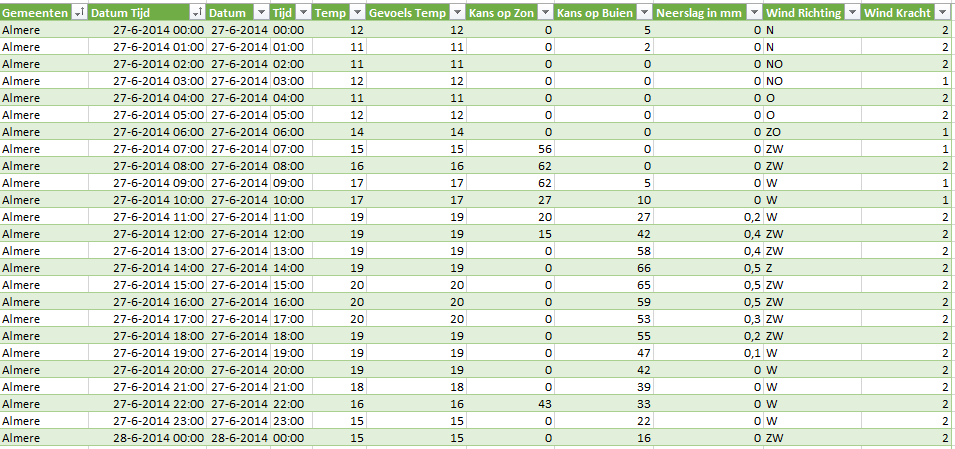
    The final data set is loaded into Power Pivot and used in the creation of the Power View reports.

    Share this

Orhan Uyan

View profile

Related IT training

Go to training website

Related Consultancy solutions

Go to infosupport.com

Related blogs

  • "Garbage in, Garbage out" Vincent Lukassen - 2 years ago

  • Data Governance, een hot topic in menig organisatie

    Data Governance, een hot topic in menig organisatie Vincent Lukassen - 3 years ago

  • Foodsector laat kansen liggen door beperkt gebruik van …

    Foodsector laat kansen liggen door beperkt gebruik van … Hans Geurtsen - 4 years ago

Data Discovery Channel

  • Modern Data Platform

  • Gartner Data & Analytics Summit 2022

  • De Data Architecture ®Evolution

Nieuwsbrief

* verplichte velden

Contact

  • Head office NL
  • Kruisboog 42
  • 3905 TG Veenendaal
  • T +31 318 552020
  • Call
  • Mail
  • Directions
  • Head office BE
  • Generaal De Wittelaan 17
  • bus 30 2800 Mechelen
  • T +32 15 286370
  • Call
  • Mail
  • Directions

Follow us

  • Twitter
  • Facebook
  • Linkedin
  • Youtube

Newsletter

Sign in

Extra

  • Media Library
  • Disclaimer
  • Algemene voorwaarden
  • ISHBS Webmail
  • Extranet
Beheer cookie toestemming
Deze website maakt gebruik van Functionele en Analytische cookies voor website optimalisatie en statistieken.
Functioneel Always active
De technische opslag of toegang is strikt noodzakelijk voor het legitieme doel het gebruik mogelijk te maken van een specifieke dienst waarom de abonnee of gebruiker uitdrukkelijk heeft gevraagd, of met als enig doel de uitvoering van de transmissie van een communicatie over een elektronisch communicatienetwerk.
Voorkeuren
De technische opslag of toegang is noodzakelijk voor het legitieme doel voorkeuren op te slaan die niet door de abonnee of gebruiker zijn aangevraagd.
Statistieken
De technische opslag of toegang die uitsluitend voor statistische doeleinden wordt gebruikt. De technische opslag of toegang die uitsluitend wordt gebruikt voor anonieme statistische doeleinden. Zonder dagvaarding, vrijwillige naleving door uw Internet Service Provider, of aanvullende gegevens van een derde partij, kan informatie die alleen voor dit doel wordt opgeslagen of opgehaald gewoonlijk niet worden gebruikt om je te identificeren.
Marketing
De technische opslag of toegang is nodig om gebruikersprofielen op te stellen voor het verzenden van reclame, of om de gebruiker op een website of over verschillende websites te volgen voor soortgelijke marketingdoeleinden.
Manage options Manage services Manage vendors Read more about these purposes
Voorkeuren
{title} {title} {title}