• Blog
  • Info Support
  • Career
  • Training
  • International Group
  • Info Support
  • Blog
  • Career
  • Training
  • International Group
  • Search
logo InfoSupport
  • Latest blogs
  • Popular blogs
  • Experts
      • All
      • Bloggers
      • Speakers
  • Meet us
  • About us
    • nl
    • en
    • .NET
    • 3D printing
    • Advanced Analytics
    • Agile
    • Akka
    • Alexa
    • Algorithms
    • Api's
    • Architectuur
    • Artificial Intelligence
    • ATDD
    • Augmented Reality
    • AWS
    • Azure
    • Big Data
    • Blockchain
    • Business Intelligence
    • Chatbots
    • Cloud
    • Code Combat
    • Cognitive Services
    • Communicatie
    • Containers
    • Continuous Delivery
    • CQRS
    • Cyber Security
    • Dapr
    • Data
    • Data & Analystics
    • Data Science
    • Data Warehousing
    • Databricks
    • DataOps
    • Developers life
    • DevOps
    • Digital Days
    • Digital Twin
    • Docker
    • eHealth
    • Enterprise Architecture
    • Event Sourcing
    • Hacking
    • Infrastructure & Hosting
    • Innovatie
    • Integration
    • Internet of Things
    • Java
    • Machine Learning
    • Microservices
    • Microsoft
    • Microsoft Bot Framework
    • Microsoft Data Platform
    • Mobile Development
    • Mutation Testing
    • Open source
    • Pepper
    • Power BI
    • Privacy & Ethiek
    • Python
    • Quality Assistance & Test
    • Quality Assurance & Test
    • Requirements Management
    • Scala
    • Scratch
    • Security
    • SharePoint
    • Software Architecture
    • Software development
    • Software Factory
    • SQL Server
    • SSL
    • Start-up
    • Startup thinking
    • Stryker
    • Test Quality
    • Testing
    • TLS
    • TypeScript
    • Various
    • Web Development
    • Web-scale IT
    • Xamarin
    • All
    • Bloggers
    • Speakers
Home » Forecasting financial measures with linear regression
  • Forecasting financial measures with linear regression

    • By Orhan Uyan
    • Business Intelligence 8 years ago
    • Business Intelligence 0 comments
    • Business Intelligence Business Intelligence
    Forecasting financial measures with linear regression

    In this blog I explain the relevant steps towards developing a Microsoft Reporting Services report in which different financial measures are compared and forecasted using the build-in MDX, linear regression function LinRegPoint of SQL Server Analysis Services. You don’t have to implement a Data Mining model with SQL Server Analysis Services in order to use the linear regression function.

    The preview of the SQL Server Reporting Services report is shown below.

    Preview SQL Server Reporting Services report
    mdx_regression_ssrs_preview_ou

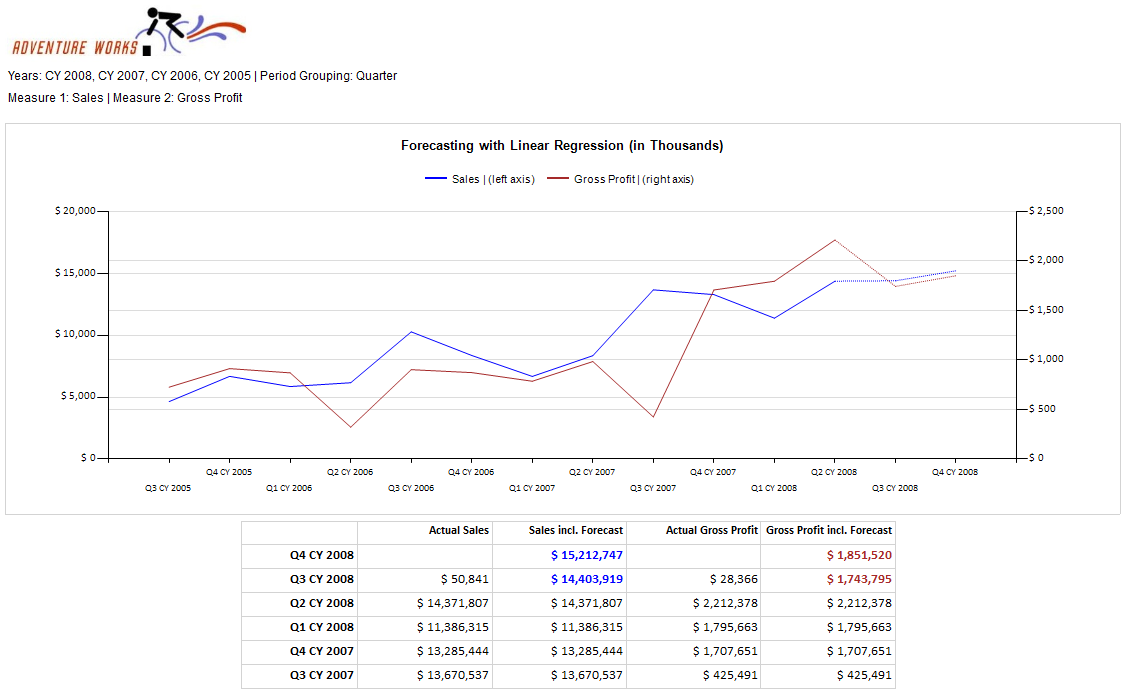
    The historical (actual) and forecasted figures are reported graphically and numerically. The measures Sales Amount and Gross Profit are plotted on the y-axis and the hierarchy level Calendar Quarter is plotted on the x-axis of the embedded graph. Each measure is aligned to a different y-axis in order to differentiate the numerical interval. The forecasted figures are represented by dotted lines and colored numbers.

    The dataset of the report contains a dynamic MDX query with embedded report parameters for the selected measures, calendar years and the hierarchy level.

    The dynamic MDX query of the SQL Server Reporting Services report is shown below.

    Dataset SQL Server Reporting Services reportmdx_regression_dynamic_ou

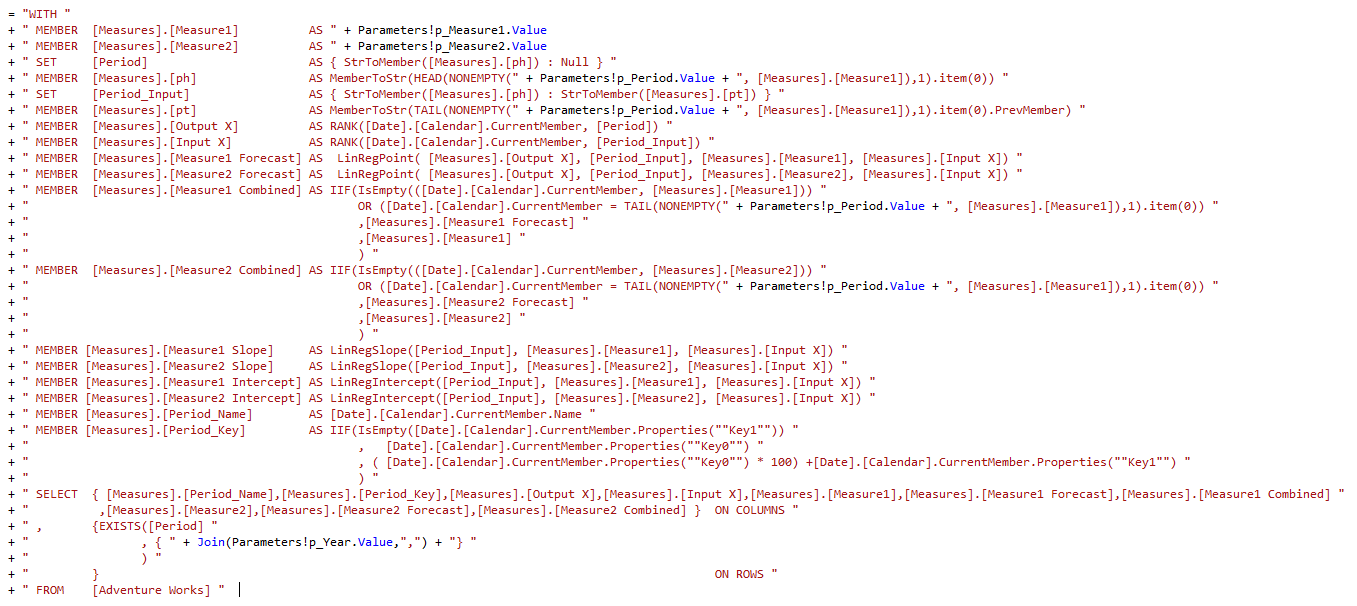
    The dynamic MDX query is the parameterized version of the static MDX query shown below.

    Static MDX Query
    mdx_regression_static_ou

    The defined Calculated Members consist of the selected financial measures and combine the historical and forecasted figures. Named Sets are defined for the selected hierarchy level and the x-axis of the calculated linear regression line. Ordinal positions are determined through the period ranking of the historical and forecasted figures and determine the x-values of the linear regression line. Additional, explanatory information about the components of the linear regression line are embedded in the MDX query and are shown in the results below.

    Results MDX Querymdx_regression_static_output_ou

    If you require a more sophisticated, precise forecasting function. You should consider implementing a Data Mining model with SQL Server Analysis Services with the Time Series algorithm.

    Share this

Orhan Uyan

View profile

Related IT training

Go to training website

Related Consultancy solutions

Go to infosupport.com

Related blogs

  • "Garbage in, Garbage out" Vincent Lukassen - 2 years ago

  • Data Governance, een hot topic in menig organisatie

    Data Governance, een hot topic in menig organisatie Vincent Lukassen - 3 years ago

  • Foodsector laat kansen liggen door beperkt gebruik van …

    Foodsector laat kansen liggen door beperkt gebruik van … Hans Geurtsen - 4 years ago

Data Discovery Channel

  • Modern Data Platform

  • Gartner Data & Analytics Summit 2022

  • De Data Architecture ®Evolution

Nieuwsbrief

* verplichte velden

Contact

  • Head office NL
  • Kruisboog 42
  • 3905 TG Veenendaal
  • T +31 318 552020
  • Call
  • Mail
  • Directions
  • Head office BE
  • Generaal De Wittelaan 17
  • bus 30 2800 Mechelen
  • T +32 15 286370
  • Call
  • Mail
  • Directions

Follow us

  • Twitter
  • Facebook
  • Linkedin
  • Youtube

Newsletter

Sign in

Extra

  • Media Library
  • Disclaimer
  • Algemene voorwaarden
  • ISHBS Webmail
  • Extranet
Beheer cookie toestemming
Deze website maakt gebruik van Functionele en Analytische cookies voor website optimalisatie en statistieken.
Functioneel Always active
De technische opslag of toegang is strikt noodzakelijk voor het legitieme doel het gebruik mogelijk te maken van een specifieke dienst waarom de abonnee of gebruiker uitdrukkelijk heeft gevraagd, of met als enig doel de uitvoering van de transmissie van een communicatie over een elektronisch communicatienetwerk.
Voorkeuren
De technische opslag of toegang is noodzakelijk voor het legitieme doel voorkeuren op te slaan die niet door de abonnee of gebruiker zijn aangevraagd.
Statistieken
De technische opslag of toegang die uitsluitend voor statistische doeleinden wordt gebruikt. De technische opslag of toegang die uitsluitend wordt gebruikt voor anonieme statistische doeleinden. Zonder dagvaarding, vrijwillige naleving door uw Internet Service Provider, of aanvullende gegevens van een derde partij, kan informatie die alleen voor dit doel wordt opgeslagen of opgehaald gewoonlijk niet worden gebruikt om je te identificeren.
Marketing
De technische opslag of toegang is nodig om gebruikersprofielen op te stellen voor het verzenden van reclame, of om de gebruiker op een website of over verschillende websites te volgen voor soortgelijke marketingdoeleinden.
Manage options Manage services Manage vendors Read more about these purposes
Voorkeuren
{title} {title} {title}