
 0 comments
 Business Intelligence
About Data Explorer
The free Excel-plugin Data Explorer has been around for a few months now. For those who don’t know about Data Explorer yet: Data Explorer can be described as a self-service ETL-tool: it extracts data from all kinds of sources, and loads it into Excel, while transforming it into a usable format. After loading the data into Excel, the data can be used for whatever you want to.
The ability to load data towards Excel has been around here for years. Connections to CSV files, databases and other sources could be made from Excel within, and data could be pulled into Excel. From Excel 2010 on, we can load data into the relational PowerPivot engine. Starting with Excel 2013 the data can be loaded into the Excel Data Model. What does Data Explorer add to the options we already had?
The options to import data into Excel without Data Explorer are via a fixed set of connectors. The connectors in Excel have the ability to connect to several types of databases, and some types of less structured data like CSV. Although there are some configuration options for those less structured data files, the options to customize are limited. Ever tried to import a CSV file with multiple header rows into Excel? (Schema.ini anyone?) Maybe a CSV file where every third row needs to be skipped? Or only the rows that have a certain value in the first column? And what about data from a HTML file, via a real (refreshable) data connection?
Until now, data that had to be loaded into Excel needed some kind of schema. In general, the schema was quite rigid. With Data Explorer, it’s possible (and quite easy, too) to load less structured into Excel, to transform it into a usable format, and to automate the transformation. This turns out to be tremendously powerful: Skipping lines based on content, moving the value of every second row inside a new column, joining multiple tables and all examples mentioned above are possible.
Of course, not all this can be covered inside one blog post – so to let’s start with a simple case. In a next blogpost we’ll build further upon this example.
Example: Let’s load some data!
Case: Suppose we want to draw all gas stations in the Netherlands on a map in GeoFlow, like displayed in the following image.
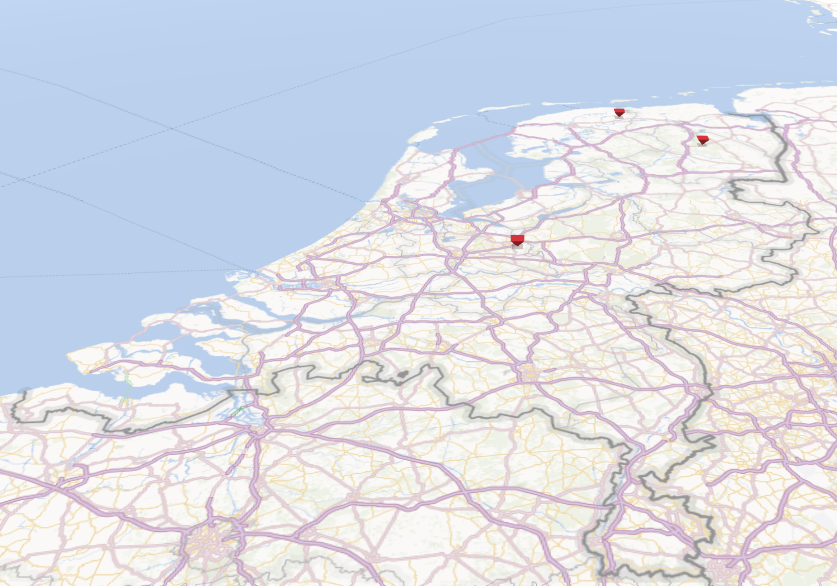
(In reality, there are more gas stations in the Netherlands. It should be clear what we want though)
Although that shouldn’t be too hard a task, after some research it seems there is no OData feed, Azure Marketplace source or another (technically easy to use) list of all gas stations in the Netherlands. Luckily, some web sites are providing a list of gas stations along with their addresses. In one case, retrieving the data would require loading several thousand pages, which may be somewhat too hard to try (try to find all addresses of gas stations at www.alletankstations.nl for example). Another site looks easier: brandstof-zoeker.nl provides an easy overview of gas stations categorized alphabetically, according to the company name of the gas station.
Initially we focus on all gas stations starting with a ‘B’, as listed on http://www.brandstof-zoeker.nl/station/B.
Inside a new Excel workbook, we head to the ‘Data Explorer’ tab on the ribbon, and select ‘Get external data’ -> ‘From Web’. This opens up a Data Explorer dialog, where we can enter the URL where our data is located.
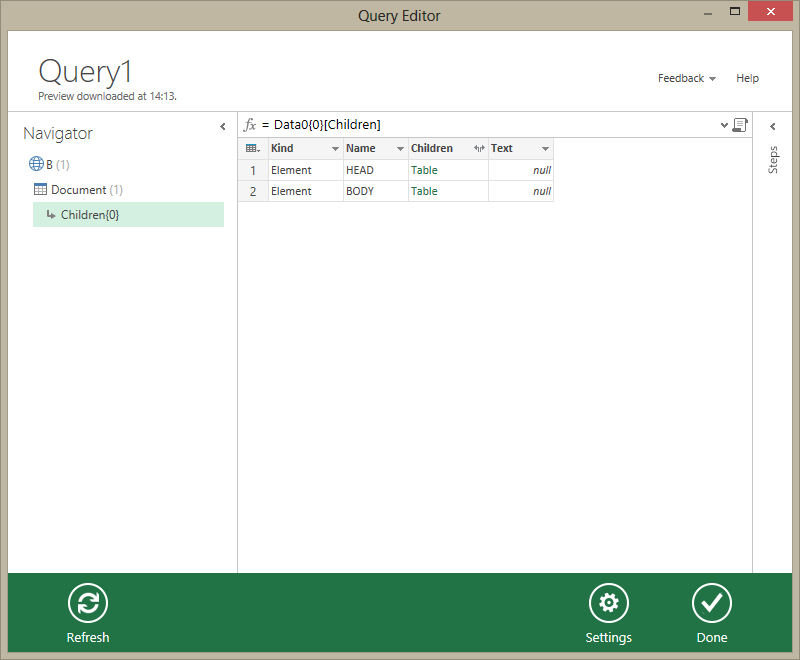
After clicking ‘OK’, Data Explorer loads the web site from the URL we provided, and gives a high-level overview of the Document Object Model (DOM). The root node of the DOM is ‘Document’. Clicking on ‘Document’ on the left shows us the contents of that node on the right.

Inside the table, the column ‘Children’ is visible. The DOM has a tree structure: the root node has children, each of which can have their own children. To drill down towards the children, click on the text ‘Table’ in the column ‘Children’. This opens a table containing the child elements which reside directly under the ‘Document’ level.
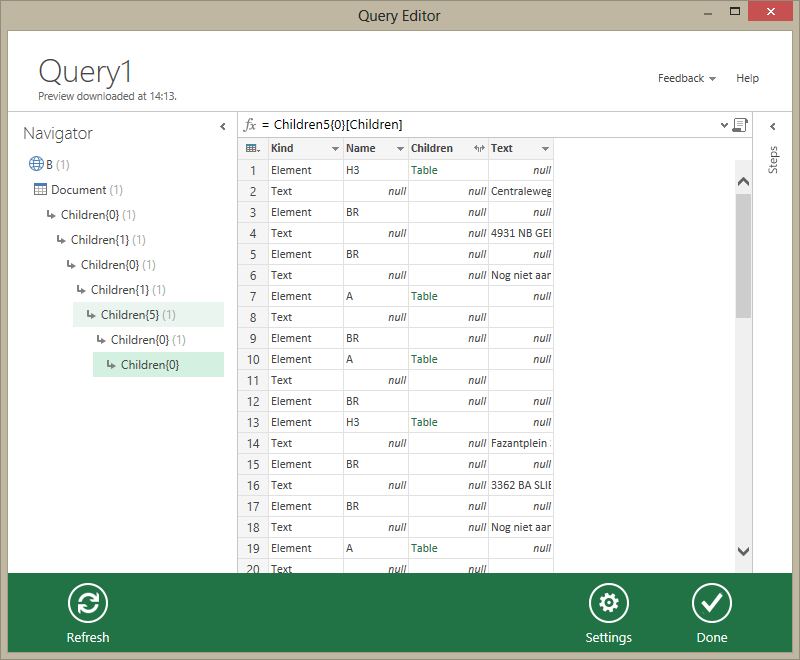
In this way, it’s quite easy to find any element in a given document, which we will be able to load afterwards. When you’ve located the place of the list gas stations in the DOM (and selected it), Data Explorer looks like the following image:
Click ‘Done’ now, and the data will be loaded to the Excel sheet.

At this moment, a real data source connection has been made towards a web page. This means that the data can be refreshed by the ‘Refresh All’ option inside Excel, and Data Explorer will take a look for us at the web address we point at.
Reflection: where are we heading?
Let’s reflect on what we’ve just done: by using Data Explorer, without any coding, we are able to retrieve data from a loose-structured source like a webpage. More than retrieving alone, we have a real, refreshable, data connection which retrieves a set of data from a website. Website updates data, we refresh source. Great, isn’t it?
In my opinion this shows the next step in self-service Business Intelligence: It has been possible to do self-service analysis using PowerPivot for several years. Inside PowerPivot data could be integrated from several sources:
- data warehouses
- production databases
- Excel files
- CSV files
- Sharepoint lists
- OData feeds
- (…)
With Data Explorer it has become quite easy to add less-structured data, that was without Data Explorer quite hard to load (and thus to integrate). Examples of these sourcesa are
- HTML files
- Hadoop data
- Active Directory users
- Facebook data (events, timelines, friends, …)
By the way: Facebook data integrates in a beautiful way – you really have to try it!
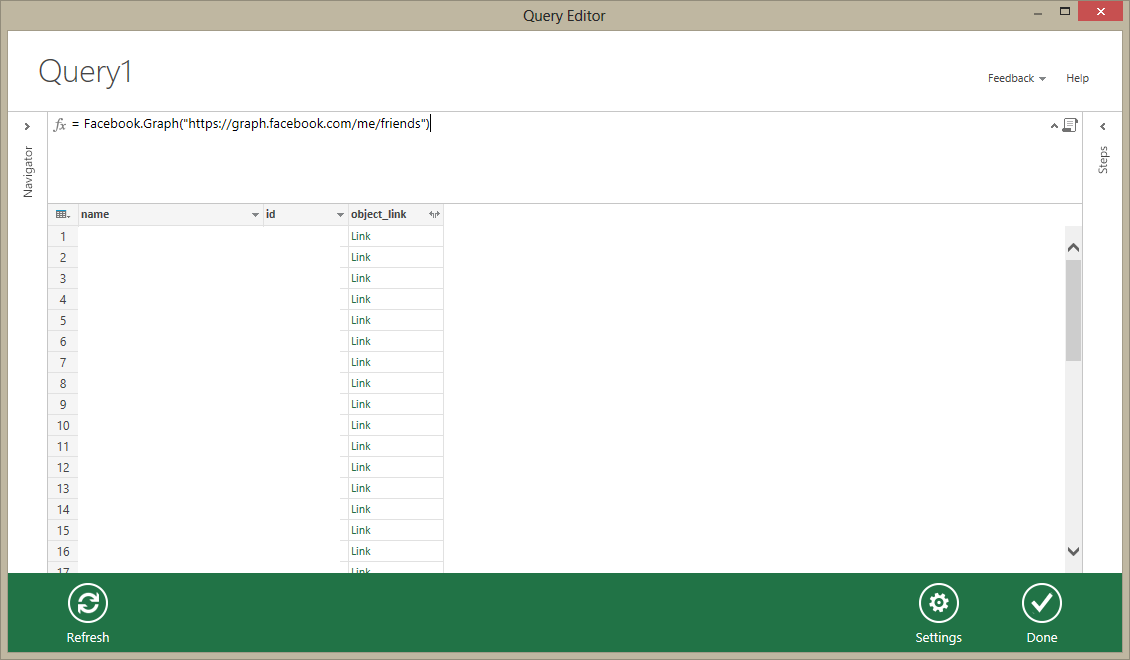
(names and id’s are removed)
Conclusion: looking forward for the next blogpost
Of course, this is not where it stops! Although it’s certainly useful to be able to load data in this way into an Excel sheet, the data we have retrieved here is not quite ready to use, because the data is dirty:
- There’s lots of ‘noise data’ (I’m not interested in the ‘H3’ elements, for example)
- All useful data is in the same column, without distinguishing hints in other columns about which data it could be:
- 3D: ‘Centraleweg’, is it a street, or maybe a town?
- There seems to be a pattern: the second row in the table (row 3 in the sheet) is an address, and every 12th row after that a new address starts. However, this pattern stops at row 195..
- The names of gas stations seem to be excluded. Further investigation learns that the H3 element has its own structure inside the DOM, so it’s located inside a new table.
In the next blogpost I will make a start with the cleansing process, by extending and programming Data Explorer.
For now, go forth and Data Explore!