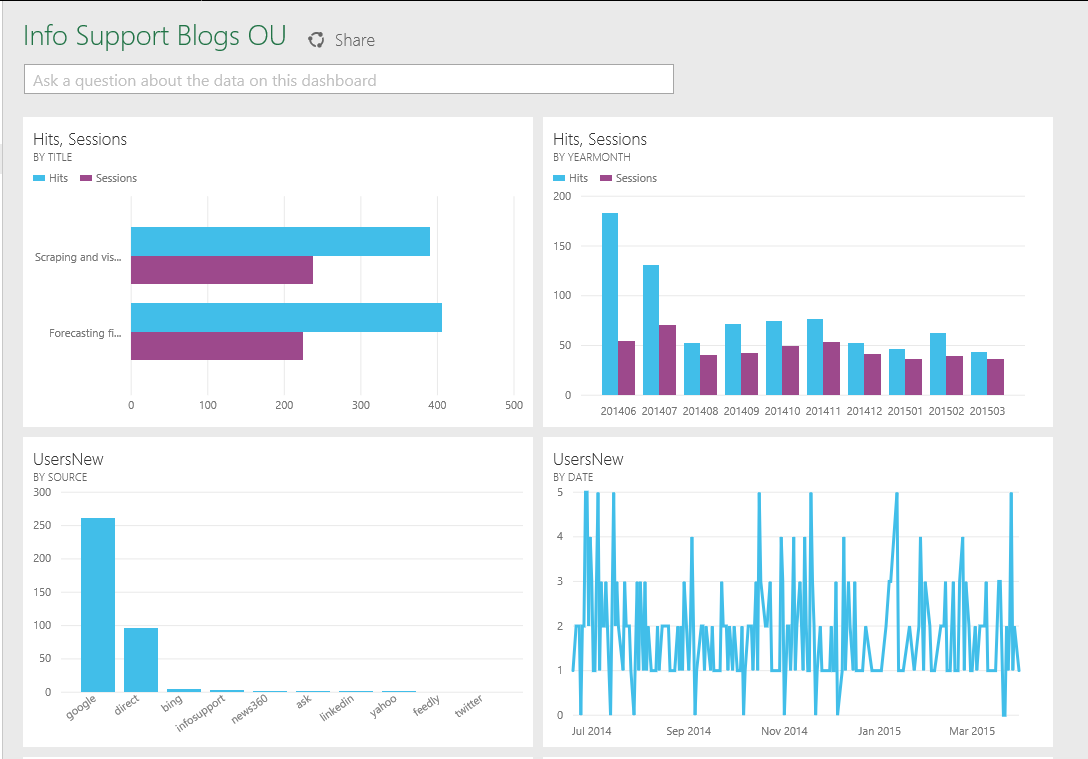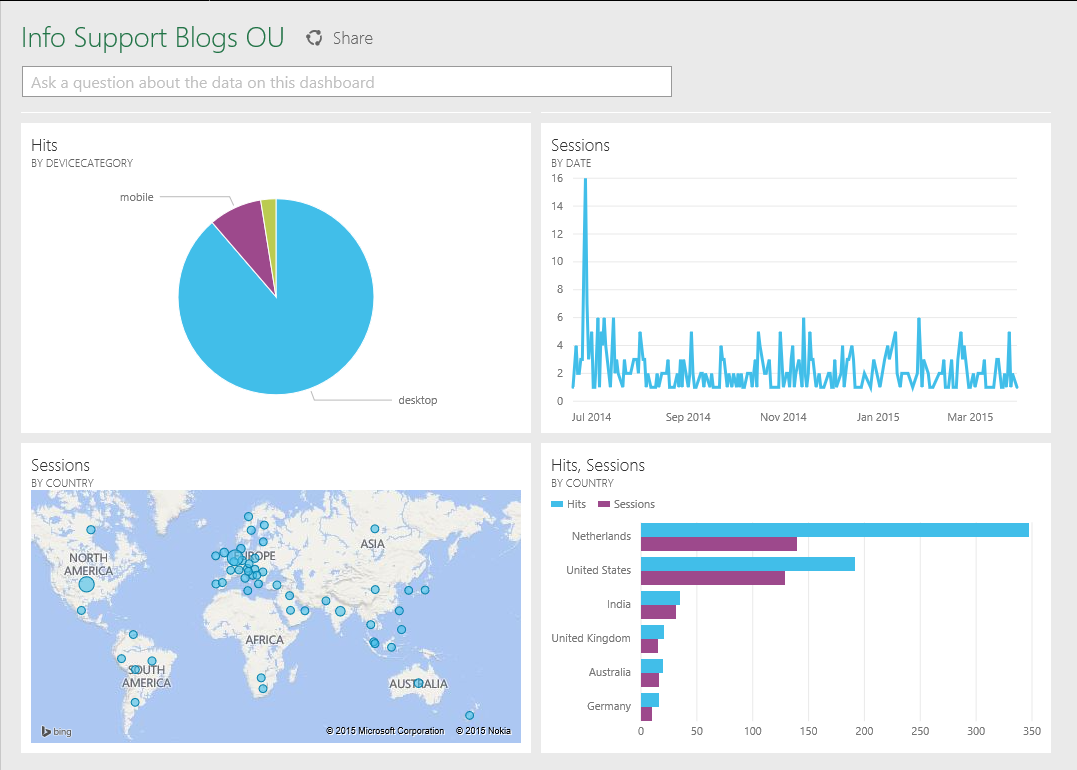
Power BI users can connect to Google Analytics and import relevant statistics about their websites. The imported statistics can be cleansed and embedded in user friendly reports and dashboards. The Power BI users are empowered each time Microsoft adds a new connector to the list of available data sources.
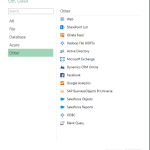
Data Sources – Power BI Designer (preview)
When the Power BI user is connected to Google Analytics he or she can select dimensions and measures from the data model which is similar to the look and feel of an Analysis Services cube. The number of dimension attributes the user can add to the query is currently limited to 7. The limitation forces the user to be more precise about the requirements.
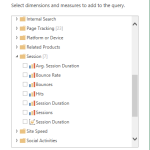
Data Model Google Analytics – Power BI Designer (preview)
The query that the Power BI user designs forms the dataset for the reports which can be built with Power BI Designer (preview). The work can be saved as a Power BI file and uploaded to the cloud service Power BI (preview).
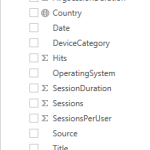
Dataset (Fields) – Power BI Designer (preview)
The Power BI user can pin components of the uploaded reports to custom dashboards. There are a lot of limitations the user should be aware of. Currently the user cannot manage the colors of the charts, cannot pin slicers to dashboards, etcetera. Despite of the limitations the overall experience of Power BI is good. Business Intelligence in the cloud seems to have big potential.
The dashboard.

 0 comments
 Business Intelligence