
 0 comments
 Software Architecture
Most of you might have noticed that I’m a big fan of NServiceBus, a very nice .NET based framework for implementing service oriented systems, based on messaging. Particular Software, the company behind NServiceBus, has been working on building a platform around NServiceBus, which turns it into much more than just a developer’s framework.
The new additions to the platform are:
- ServiceMatrix, a slick designer, embedded in Visual Studio to aid development of NServiceBus solutions
- ServiceInsight, a debug/diagnostics tool that helps to track messages and message conversations
- ServiceControl and ServicePulse, a dynamic duo that lets us monitor production environments
While these components can actually work together in a complete solution, I’ll focus on ServiceControl and ServicePulse in three consecutive blogposts. These two work together to provide overview and control over a running NServiceBus deployment in production. I’ll explain what each of these components do.
TL;DR – how to get up and running:
- Download and install ServiceControl
- Download and install ServicePulse
- Enable auditing on your NServiceBus endpoints
- Drop the Heartbeat ServiceControl plugin in your service’s bin folder and restart your service
- Start the ServicePulse front end
- Sit back and relax
Want more detail? First, let’s look at the problems ServiceControl and ServicePulse solve.
Distributed systems, distributed messages
The beauty – in my opinion – of NServiceBus is that it is a true implementation of the Service Bus architectural pattern, yielding a distributed system based on a decentralized messaging infrastructure. In essence, much like Ethernet, “the bus is everywhere”. With many independent, autonomous services running all over your data center, sending messages all over the place, how do you keep track of how it’s doing? How do you deal with messages that fail, and end up in an error queue in such a distributed architecture? With NServiceBus, there is no central broker through which all messages flow, which you could measure and monitor.
This has been a real challenge with NServiceBus up until now. I’ve seen many Roll Your Own solutions (including in my own project), and the use of 3rd party tools like QueueExplorer to deal with failed messages. Particular of course recognized this, resulting in the new tool suite, part of which is ServicePulse.
So what is ServicePulse?
ServicePulse is a system administrator’s best friend – a dashboard for monitoring the health and activity in a running NServiceBus ecosystem.
ServicePulse is basically a website, built with NancyFx that shows the status of your system in a nice dashboard overview:
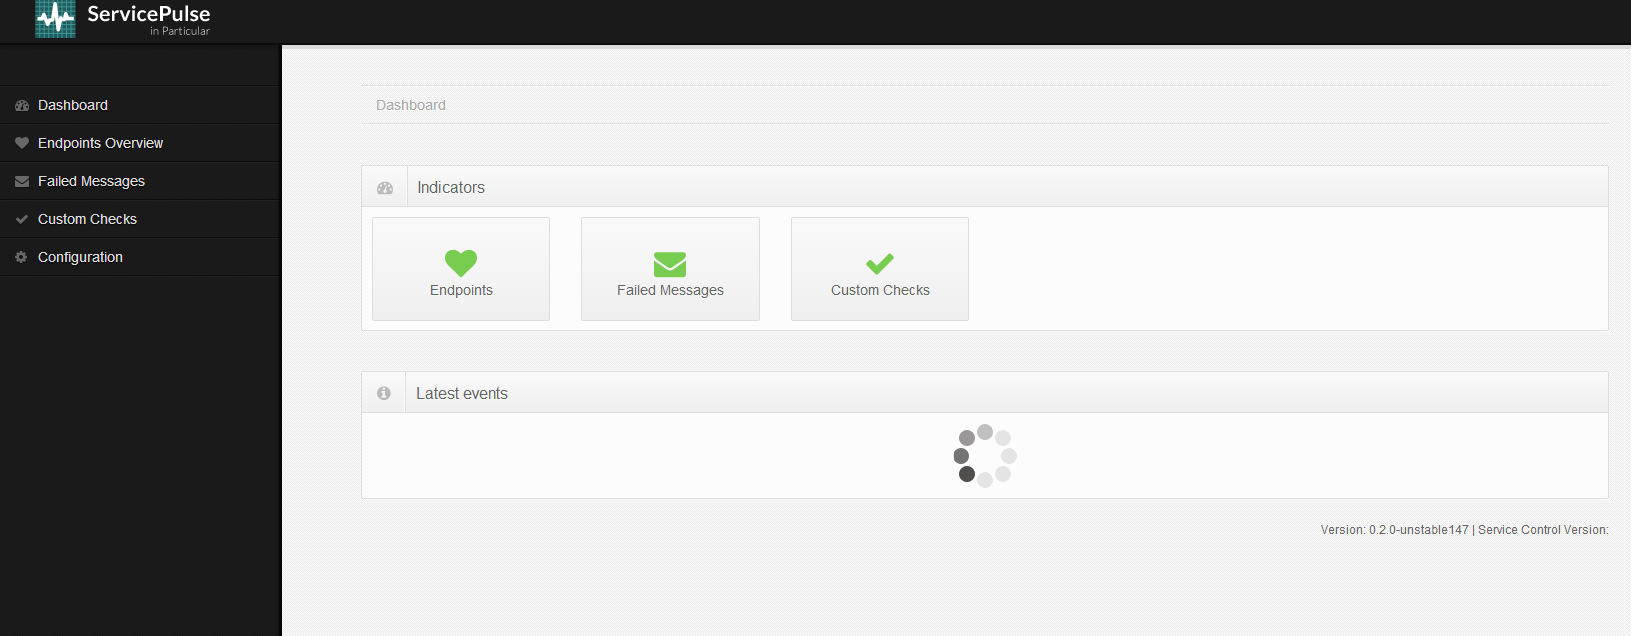
What’s fun about this website, is that it updates in near realtime with the aid of SignalR. This is a nice example of the combination of NServiceBus and SignalR in action to provide “messaging” all the way into the front end. The two mix well together, I have blogged about it before as well.
ServicePulse architecture
Let’s dive into the architecture of this solution, and see how ServicePulse deals with the distributed nature of all our services.
As mentioned, there is no central broker in a distributed system that uses NServiceBus that you can easily stick a monitor on top. So, to get health information in a central dashboard, we need to somehow gather the information centrally.
Actually, ServicePulse is just a website that leverages another component in the Particular Service Platform as a backend: ServiceControl. ServiceControl is an NServiceBus service itself that exposes a REST API for consumers like ServicePulse. A typical deployment would look like this:

One “best practice” with NServiceBus is to have a central error queue, so that you can monitor failed messages in one place. ServiceControl feeds off that error queue. Pretty smart, because this enables us to just “click on” ServiceControl like a LEGO piece.
Next, ServiceControl also wants to know about the activity in your system. It does this by feeding off the audit queue, much in the same fashion as the error messages. Having a centralized audit queue is also considered a good practice. And now we finally have a service that consumes all these messages and does something useful with it. 🙂 Make sure to enable auditing on all services you want to monitor.
ServiceControl can listen to only one audit and one error queue and ServicePulse can only listen to one ServiceControl instance. This is OK if you follow these best practices, but if you for some reason decide to have a different deployment strategy, you need to account for this.
Note that ServiceControl consumes the messages off these queues, so both audit and failed messages are now under control of ServiceControl, which stores them in a RavenDB database. This means that you have to be careful with this data and make sure that it’s properly backed up. Remember, failed messages contain valuable business data! ServicePulse doesn’t do a lot with the audit messages, but ServiceInsight does. ServiceInsight is a different topic altogether. Also keep in mind that ServiceControl is not a long term storage solution. It will clean up the database with a configurable interval (e.g. 2 weeks). So if you need to adhere to compliancy rules that require you to keep an audit trail of messages for several years, make sure you regularly backup the database, or extract the messages from ServiceControl to store it in a durable place.
By the way, when I say “queue”, I don’t necessarily mean an MSMQ queue. Just like NServiceBus itself, ServiceControl is transport agnostic, so you can also use it when you do SQL Server transport, RabbitMQ or ZeroMQ, for example.
Of course you can also use the ServiceControl REST API yourself to get information from your system and report it to other monitoring environments. For example, I’m thinking of having some of this information published to our New Relic account. Something for another blogpost 🙂
Important to note: ServiceControl by default listens to the http://localhost:33333 endpoint. ServicePulse will try to access ServiceControl via that url directly from the browser. If you want to use ServicePulse from a remote browser, you will need to tweak these url’s and ports during installation. You can tweak this configuration as described on the Particular docs site.
Enabling monitoring on endpoints
So with this basic setup, ServiceControl can now pull in error and audit messages. If you were to fire up the ServicePulse dashboard now, you’d see messages along the lines of:
New ‘MyService.MyEndpoint’ endpoint detected at ‘HOSTNAME’. In order for this endpoint to be monitored the plugin needs to be installed.
“The plugin”? What plugin? Here comes the magic… 🙂
If you want your service to be monitored, it must send a heartbeat to ServiceControl. It does this by means of a heartbeat plugin, a component that you just drop in the bin directory of your service. It will automatically be picked up when the service is (re)started. It implements the IWantToRunWhenBusStartsAndStops interface, so it gets invoked by NServiceBus automatically.
The plugin is described on the Particular docs, but the gist is that you just download the ServiceControl.Plugin.Heartbeat Nuget component into your endpoint project. Alternatively, you can extract the DLL and just drop it in the deployment folder of your services.
The plugin reports to ServiceControl via messaging, just like your own services. It does so by reporting to the Particular.ServiceControl input queue. The deployment now looks like this:

Now, if a service goes down, ServicePulse will report this immediately:

The administrator can now react, fix the problem and bring the service back online.

How cool!
Next up: Custom checks and Dealing with failed messages. Stay tuned!

![]()