
 0 comments
 Business Intelligence
In the previous blogposts, I’ve provided an introduction to Data Explorer, as well as an introduction into the Data Explorer language. In this blogpost, we’ll put this knowledge to use by re-structuring less-structured data from a website.
Our goal is to display information about gas stations in the Netherlands on an Excel GeoFlow map. For the details, have a look at my first post. In summary, the result of the import operation so far is the following Data Explorer Language-query:
let
    Source = Web.Page(Web.Contents("http://www.brandstof-zoeker.nl/station/B")),
    Data0 = Source{0}[Data],
    Children = Data0{0}[Children],
    Children1 = Children{1}[Children],
    Children2 = Children1{0}[Children],
    Children3 = Children2{1}[Children],
    Children4 = Children3{5}[Children],
    Children5 = Children4{0}[Children],
    Children6 = Children5{0}[Children],
    FirstElement = Table.First(Children6)
in
    Children6
The query returns (in the form displayed above) the addresses of gas stations. The corresponding names are contained inside the ‘FirstElement’ variable.
The starting point of this blog is contained in the Excel-file Cleansing data in Data Explorer – starting point.
The gas stations and their addresses are successfully loaded into Excel, and a data connection is made from Excel to the website. This means that the data is refreshable, so when the website changes content, I’ll be able to load the new data with a click on Excel’s ‘Refresh All’ button. However, the data we’ve loaded so far is dirty, and not all data is in separate columns: in fact, only one column is available containing the addresses of the gas stations, spread across multiple rows. Below is a sample displayed of the rows we’ve loaded until now:
| Kind | Name | Children | Text |
| Element | H3 | [Table] | |
| Text | [Table] | Centraleweg 2 | |
| Element | BR | [Table] | |
| Text | [Table] | 4931 GB Geertruidenberg | |
| Element | A | [Table] | |
| Text | [Table] | ||
| Element | BR | [Table] | |
| Element | A | [Table] | |
| Text | [Table] | ||
| Element | BR | [Table] | |
| Element | H3 | [Table] | |
| Text | [Table] | Fazantplein 3 | |
| Element | BR | [Table] | |
| Text | [Table] | 3362 BA SLIEDRECHT | |
| Element | BR | [Table] | |
| Text | [Table] | Nog niet aangesloten bij |
In general, all relevant data is inside the ‘Text’ column, without any hint of what information resides on which row. For example, the second row is a street address, and the fourth row is a combination of a Dutch postal code (‘4931 NB’) and a town (‘Geertruidenberg’). The names of the gas stations are hidden, because they ‘live’ inside the H3 element, which has its own ‘tree’ inside the DOM structure. As said, this element is already present in the Data Explorer Language query, inside the ‘FirstElement’ variable.
In order to use the data in the table above inside GeoFlow, it would be nice to have the data structured in this way:
| Name | Address | Postal Code | City |
| B.V. BEM Geertruidenberg | Centraleweg 2 | 4931 GB | Geertruidenberg |
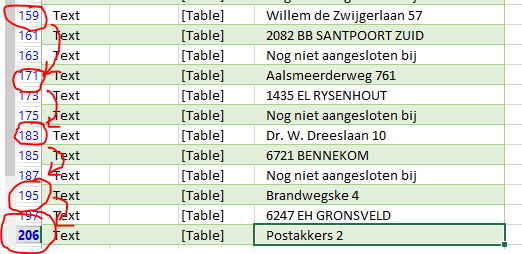
Our task will therefore be to ‘convert’ the data from the first into the second structure. To do that, we should be able to determine which type of data lives where. But as it turns out, there is (at the moment) not a fixed interval in which data appears. Addresses appear for example on Excel-row 3, 15 and 27 (corresponding to table rows 2, 14 and 26, because Excel adds a header to the table). This suggests an interval of 12 rows after each address. However, it turns out this isn’t something we can depend on: at row 206 is also an address – which should have been row 207 according to the interval of 12 rows between each address.
Once we remove rows containing no address information, the data becomes much cleaner: every first row then contains an address, and every second row a combination of postal code and town. We can check this easily by setting an Excel filter on all rows without data and all data starting with ‘Nog niet aangesloten bij’:
Although applying a filter helps us to visually filter noise data, it isn’t the real solution: this data is still not accepted by GeoFlow. Even if it was, we don’t want useless data to be stored in our Excel sheet (or Excel Data Model). In this post we will filter all noise data during the load process, thus cleansing the data.
Before we start
When you’re already technically skilled inside Excel and have some experience in programming, it’s possible to skip my first two blogs about Data Explorer, because they’re introductory. If you get stuck, remember to get back at them :-).
The situation where we start is a Data Explorer connection to the website http://www.brandstof-zoeker.nl/station/B. Inside Data Explorer, find out where the data displayed in the top table is is located, and load that data. The ‘Advanced Query Editing’ option of Data Explorer is turned on, so we can manually edit the Data Explorer Language formulas.
Cleansing the data
For starters, we will remove all rows without a value in the ‘Text’ column from the dataset. In order to do that, we take the first formula from the last blogpost, and filter the variable ‘Children6’. We do this using the function Table.SelectRows. Table.SelectRows expects two arguments:
- the source (i.e. the table where rows needs to be selected from)
- A function that will test per row if it needs to be included
Completed, the function looks as follows (the bold part is added, the strikethrough part is removed from the ‘original’ expression):
let
    Source = Web.Page(Web.Contents("http://www.brandstof-zoeker.nl/station/B")),
    Data0 = Source{0}[Data],
    Children = Data0{0}[Children],
    Children1 = Children{1}[Children],
    Children2 = Children1{0}[Children],
    Children3 = Children2{1}[Children],
    Children4 = Children3{5}[Children],
    Children5 = Children4{0}[Children],
    Children6 = Children5{0}[Children],
    FirstElement = Table.First(Children6),
    SelectedRows = Table.SelectRows(
				Children6
				, each Text.Trim(_[Text]) <> ""
			)
in
    Children6SelectedRows
As first argument (the table source) we use ‘Children6’ (the result set we’ve been working with, and which is partially shown in the top table). The second argument of Table.SelectRows tests for every row in the table if the column ‘Text’, once stripped from leading and trailing spaces, is not empty:
each Text.Trim(_[Text]) <> ""
In this way, only non-empty rows will be in the result set.
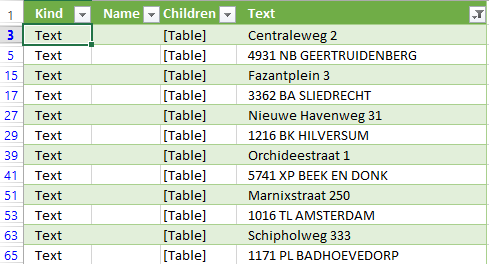
This reduces the set somewhat, but still there’s much noise data. One thing that stands out, is the empty cells still being present the [Text] column. Those empty cells have one common feature: on the same row, in the column [Kind], is anything but the value ‘Text’. Without diving any further into technical details (yes, it’s about NULL values), it seems to be a good idea to return only elements of the type ‘Text’ – the other elements don’t contain any useful information anyway. Besides that, we can also filter on the text ‘Nog niet aangesloten bij’ (Dutch for ‘not connected to’ – this text is not about address data). In the next table, I’ve marked the ‘text’-kind green, and the ‘Nog niet aangesloten bij’ text red, representing both the positive and negative filter:
| Kind | Name | Children | Text |
| Element | H3 | [Table] | |
| Text | [Table] | Centraleweg 2 | |
| Element | BR | [Table] | |
| Text | [Table] | 4931 NB GEERTRUIDENBERG | |
| Element | BR | [Table] | |
| Text | [Table] | Nog niet aangesloten bij | |
| Element | A | [Table] | |
| Element | BR | [Table] | |
| Element | A | [Table] | |
| Element | BR | [Table] | |
| Element | H3 | [Table] |
Summarizing, we only want rows where the following constraints apply:
| Column name | Constraint | Value |
| Kind | Is equal to | Text |
| Text | Is not empty | |
| Text | Does not start with | Nog niet aangesloten bij |
To add those clauses to the Table.Select-function, we alter the expression as follows (the bold text is added):
let
    Source = Web.Page(Web.Contents("http://www.brandstof-zoeker.nl/station/B")),
    Data0 = Source{0}[Data],
    Children = Data0{0}[Children],
    Children1 = Children{1}[Children],
    Children2 = Children1{0}[Children],
    Children3 = Children2{1}[Children],
    Children4 = Children3{5}[Children],
    Children5 = Children4{0}[Children],
    Children6 = Children5{0}[Children],
    SelectedRows = Table.SelectRows(
				Children6
				, each Text.Trim(_[Text]) <> ""
                                       and _[Kind] = "Text"
                                       and not Text.StartsWith(_[Text], "Nog niet aangesloten bij")
			)
in
    SelectedRows
The result is a relatively clean table – most of the noise data has disappeared. To finish the cleansing part, let’s return only the coluimn we are interesting in: the [Text] column. This results in this query:
let
    Source = Web.Page(Web.Contents("http://www.brandstof-zoeker.nl/station/B")),
    Data0 = Source{0}[Data],
    Children = Data0{0}[Children],
    Children1 = Children{1}[Children],
    Children2 = Children1{0}[Children],
    Children3 = Children2{1}[Children],
    Children4 = Children3{5}[Children],
    Children5 = Children4{0}[Children],
    Children6 = Children5{0}[Children],
    SelectedRows = Table.SelectRows(
				Children6
				, each Text.Trim(_[Text]) <> ""
                                       and _[Kind] = "Text"
                                       and not Text.StartsWith(_[Text], "Nog niet aangesloten bij")
			),
    Addresses = SelectedRows[Text]
in
    Addresses
The top 10 rows now looks as follows:
| Value |
| Centraleweg 2 |
| 4931 NB GEERTRUIDENBERG |
| Fazantplein 3 |
| 3362 BA SLIEDRECHT |
| Nieuwe Havenweg 31 |
| 1216 BK HILVERSUM |
| Orchideestraat 1 |
| 5741 XP BEEK EN DONK |
| Marnixstraat 250 |
| 1016 TL AMSTERDAM |
The last operation changed the dataset structure though: because we’ve selected a column out of a table, the variable ‘Addresses’ doesn’t contain a Table, like ‘SelectedRows’ did, but it contains a List. That means that, when further processing this data, we can’t use formulas like ‘Table.SelectRows’ any more: the ‘Table.’ part implies those formulas are meant for tables. Instead, we’ll have to use formulas starting with ‘List’. But that’s something for next blogpost :-).
One more thing: adding more sources
Although we’ve accomplished our goals of cleansing the data, here is a bonus: Until now, we’ve only used one page of gas station, namely all gas stations starting with a ‘B’. As you can see on the website we use as a source, there are more gas stations available.
We can combine these in several ways, but for now I’ll display an easy way to add several sources and combine them into one result set. Using the Table.Combine function we can combine several sources, in the following way:
let
    SourceC = Web.Page(Web.Contents("http://www.brandstof-zoeker.nl/station/B")),
    SourceB = Web.Page(Web.Contents("http://www.brandstof-zoeker.nl/station/B")),
    SourceA = Web.Page(Web.Contents("http://www.brandstof-zoeker.nl/station/A")),
    Source = Table.Combine({SourceA, SourceB, SourceC})
(...)
The table.combine function takes one argument: a list of tables. By using the curly braces (‘{‘ and ‘}’), we are creating this list. Using this information, it is quite easy to add all categories.
Of course, it would be even better to import the page containing all categories, and from there on import all gas stations automatically. That isn’t too hard either – and after the next blog, you should be able to do that by yourself.
Conclusion
In this blogpost we looked at the cleansing of data. The result is now that Data Explorer returns a list (instead of table) containing all address data to Excel. The only thing remaining now is to transform this data into the desired format presented above. Which will be taken care of in the next blog.
The result for now (including the bonus), can be found here: Cleansing data in Data Explorer – solution.